

Too Long? Read This First
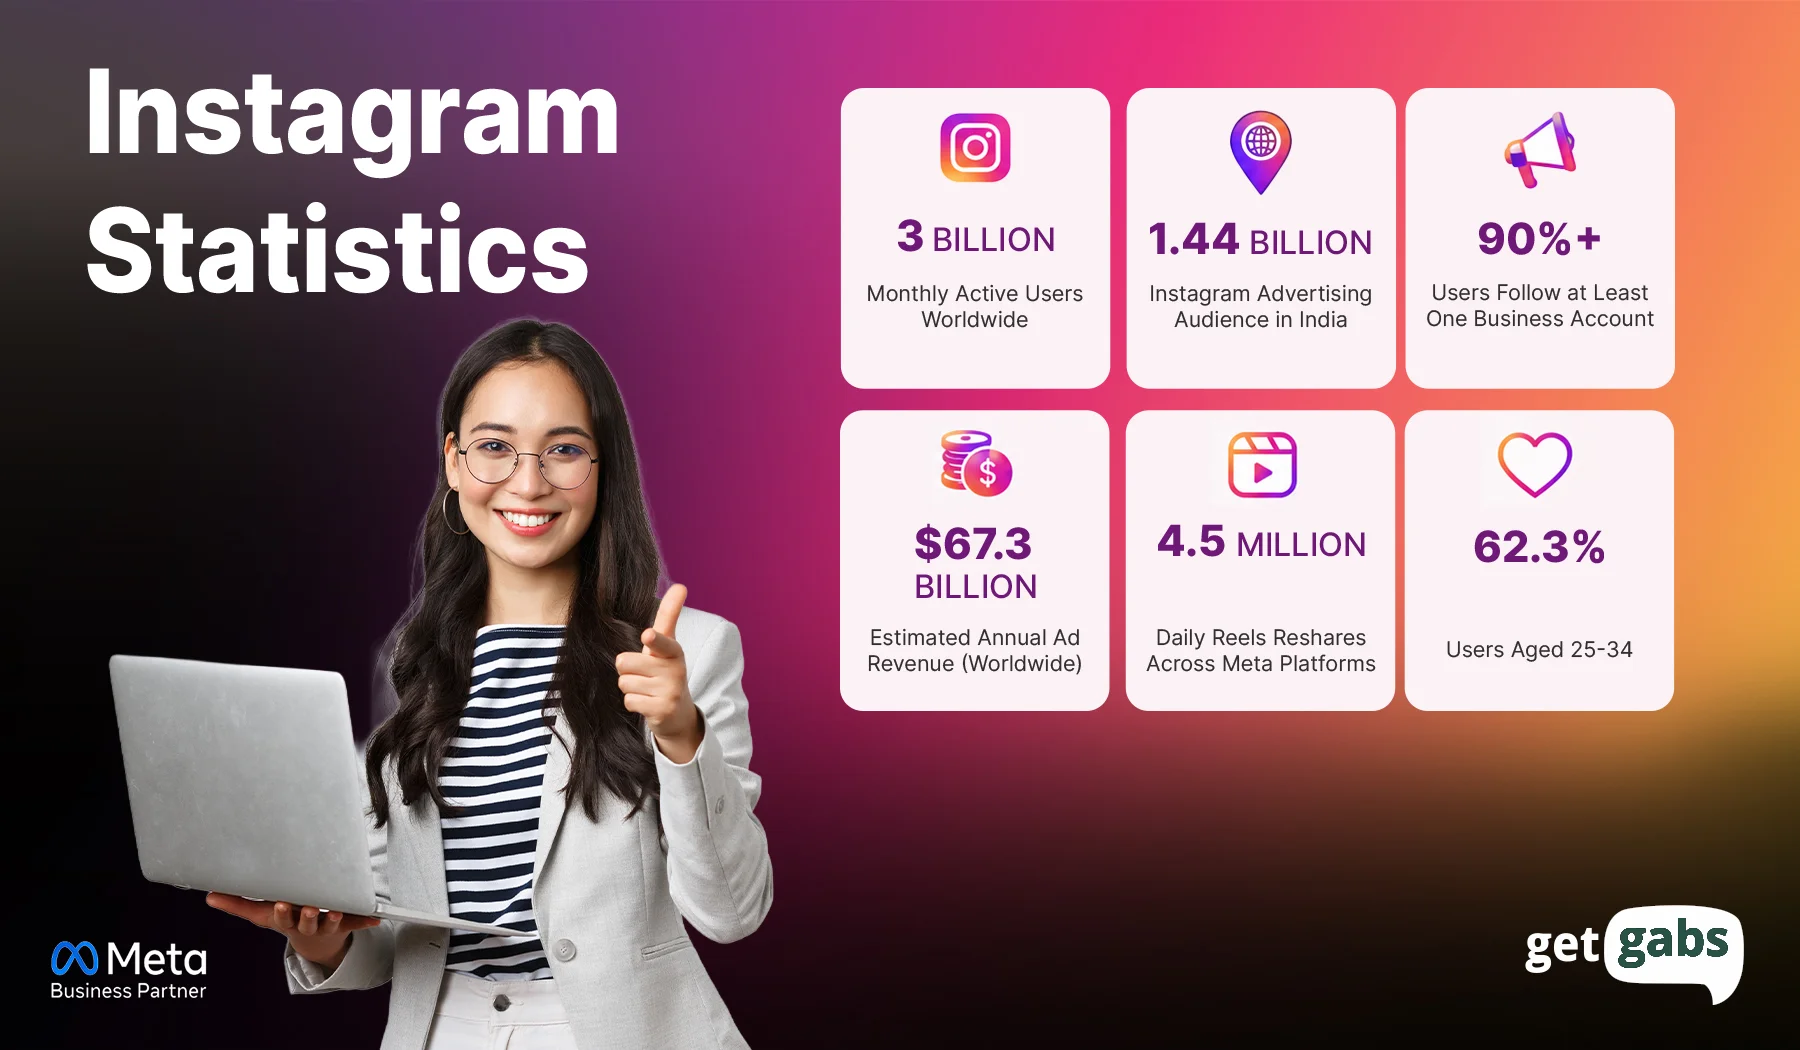
- Instagram has about 3 billion monthly users, roughly one in three people on Earth, and its audience grew 8% in a year. India leads with about 480.55 million users, ahead of the US and Brazil.
- More than 60% of users are under 35, and 25 to 34 is the biggest age group. Globally, about 52.5% of users are male, but in the US, more women use it.
- Carousels (about 0.55%) and Reels (about 0.52%) lead engagement; Reels take up about half of the time people spend on the app, and more than 500 million accounts use Stories every day.
- Instagram is projected to earn $42.52 billion in US ad revenue in 2026, 78% of social media marketers use it, and nano-influencers cost as little as $55 per Reel.
- Many buyers message a brand before they buy, and slow replies lose sales, so Getgabs Instagram DM automation replies in seconds and passes serious buyers to your team.
Instagram statistics 2026 reveal something that most brands miss. The numbers are not a scoreboard; they are a map to your next customers.
It shows where their audiences spend most of their time, what content catches their attention, and how businesses can turn that attention into growth. For brands, Instagram is no longer just a place to share photos. It is a channel that businesses can use to build trust, showcase products, connect with customers, and drive sales.
But new trends, rising competition, and changing user habits often come down to one question. What actually works on Instagram?
This guide by Getgabs will break down the latest Instagram statistics on users, audience demographics, engagement rates, advertising, Reels, and business trends. You will learn what these numbers mean for your marketing strategy and how to use them to reach the right audience, choose the formats that work, and turn busy DMs into real sales.
Instagram User Statistics 2026: How Many People Use It?
Instagram has a massive audience that makes it an important channel for businesses that want to reach a large number of people. But global users tell only one part of the story. Where those users live, how the platform is growing, and how people connect on Instagram also matters.
| 3 billion | +8% | 🇮🇳 553 million | 86%+ |
| Monthly users worldwide | Audience growth in one year | Users in India (the biggest market) | People use it in the UAE, Uruguay, and Brazil |
1. Instagram has 3 billion monthly active users worldwide
Instagram now has 3 billion active monthly users globally. That’s approx. one-third of the world’s population. This milestone shows how far the platform has grown beyond photo sharing, with Reels, recommendations, and DMs playing a major role. The platform remains one of the biggest social networking channels for businesses.
A large audience creates opportunities, but your content still needs to reach the right people and give them a reason to engage. Plus, it gives marketers more room to build niche communities and run large-scale campaigns.
2. Third Most Used Social Media Platform
As per a Neowin report, Instagram is the third Meta app to pass 3 billion monthly users. Here is how the three compare:
| Meta app | Monthly users (DataReportal) |
| 3.07 billion | |
| 3.0 billion | |
| 3.0 billion |
Why it matters: Your customers use these apps together.
3. India has the largest Instagram Users
India leads the world in Instagram users with 480.55 million users. Next on the list come the United States, Brazil, Indonesia, and more.
| Rank | Country | Estimated advertising audience |
| 1 | India | 480.55 million |
| 2 | United States | 181.75 million |
| 3 | Brazil | 147 million |
| 4 | Indonesia | 107.6 million |
| 5 | Japan | 63.2 million |
These figures help businesses identify markets with a large number of potential audience. However, the biggest market is not always the best choice; that’s why you should always consider your target customers, local demand, and campaign goals.
4. Around 65% of consumers have an Instagram profile
As per Sprout Social’s 2026 Social Media Report, around 65% of consumers have an Instagram profile. It shows how widely the platform is used by consumers.
Instagram helps people discover your brand, learn about your product, and build trust before the purchase. Businesses can share useful posts, product updates, and customer stories to promote their products or services.
Instagram Demographics 2026: Who Uses Instagram?
Knowing how many users use Instagram is just half of the story. Learning the platform popularity that varies by age and gender helps brands create content that matches their audience interests and choose better marketing strategies.
| 60%+ | 25–34 years | 52.5% | 55% |
| Of Instagram users are aged 18–34 | The largest age group on Instagram | Of the global audience is male | Of US adults in urban areas use Instagram |
5. Instagram users by age group
According to Statista, users aged 25–34 make up Instagram’s largest audience segment, followed by those aged 18–24.
| Age group | Share of Instagram’s global audience |
| 18–24 years | 27.6%–29.7% |
| 25–34 years | 33.3%–34% |
| 35–44 years | 16.6%–17.4% |
| 45–54 years | Under 10% |
| 55+ years | Smaller share |
If your target audience includes younger adults, Instagram should be at the top of your priority list.
6. Instagram users by gender
Instagram audience includes both female and male users. However, usage differs by country and research method. In Pew Research Center’s 2025 US survey, 55% of women reported using Instagram in the US, compared with 44% of men.
Around 52.5% of Instagram’s worldwide audience is male, while 46.4% identify as female. Use Instagram insights to know your followers’ gender, age, and location to curate tailored content and campaigns.
7. Instagram usage is higher in urban and suburban areas
As per the Pew Research Center, 55% of US adults live in urban areas and 54% in suburban areas, compared with 37% in rural areas. This insight offers useful context for regional campaigns, local targeting, and businesses that have metro-area audiences.
However, the brands that are targeting rural customers should also consider other social media channels to reach their audience more effectively.
How People Use Instagram in 2026: Time Spent and Daily Habits
Learning about how people use this social media channel helps you win their attention. These section insights will tell you how long they stay, how often people open the app, and what it means for your content.
| 33–34 minutes | 49 hours/month | 32% | 41% |
| Average daily time spent on Instagram worldwide | Average monthly time spent by Indian users | Users expect to spend more time on Instagram in 2026 | Gen Z users expect to spend more time on Instagram in 2026 |
8. Users spend about 33 minutes a day on Instagram
Instagram users worldwide spend approx. 33 to 34 minutes on this app. However, the daily and monthly average might vary by age group or region. According to BofA Global Research, Indian users spend an average of 49 hours per month on Instagram.
It breaks down to roughly 1.6 hours a day, making it one of the most used apps in India by monthly usage time. But remember, people scroll fast, so you only have seconds to grab the user’s attention.
9. Instagram is widely used by social media users
Approximately 35.34% of the world’s active social media users regularly access Instagram and have a profile on it. The platform allows businesses to reach customers, build awareness, and introduce them to new products.
10. Many users plan to spend more time on Instagram in 2026
According to Sprout Social, 32% of Instagram users expect to spend more time on the platform in 2026. When it comes to Gen Z users, the figure rises to 41%, which makes Instagram a leading choice if you target this audience of young generation.
For marketers, this signals an opportunity to invest in engaging content, creator partnerships, and targeted campaigns to connect with growing audiences.
11. Instagram inspires users to discover new products
From trending Reels to influencer recommendations, Instagram gives users many ways to discover products and explore new brands. Sprout Social’s 2026 Social Media Content Strategy Report found that more than a quarter of social media users across every generation use Instagram to find products they may want to buy.
Businesses can use product demos, creator collaborations, and customer reviews to help potential buyers explore their offerings and make informed purchase decisions.
Instagram Engagement Rate Statistics: What Gets More Interaction?
Engagement rate shows businesses how many people like, comment, share, or save their posts. It is one of the best ways to see whether your content works or not.
| 2%–6% | 0.55% | 0.52% | 0.30% |
| Engagement rate for nano-influencers | Engagement rate for carousels | Engagement rate for Reels | Median engagement rate for brand accounts |
12. Instagram engagement rates vary by follower count
Instagram engagement rates often decrease as an account gains more followers. Smaller creators may have closer connections with their audience, while larger accounts reach a wider mix of people.
According to Colorlib’s Instagram engagement rate guide, estimated rates vary by follower tier:
| Account type | Reported engagement rate |
| Nano-influencers (1K–10K) | 2%–6% |
| Micro-influencers (10K–50K) | 1%–4% |
| Mid-tier accounts (50K–500K) | 0.9%–1.8% |
| Macro-influencers (500K–1M) | Around 0.9% |
| Mega-influencers (1M+) | 0.5%–0.9% |
| Brand accounts | Around 0.30% median |
13. Engagement rates differ by content format
Colorlib reports the following engagement rates by Instagram content type:
| Content format | Reported engagement rate |
| Carousels | 0.55% |
| Reels | 0.52% |
| Static images | 0.37% |
The report also notes year-over-year changes of a 4% increase for Reels and an 18% decline for static images. Check the source’s reporting period and engagement-rate formula before publishing these figures as 2026 benchmarks.
For businesses, carousels are worth testing for educational posts, Reels for discovery, and static images for product updates. Compare results using the same engagement formula and time period to see which format works best for your audience.
Instagram Reels Statistics: How Big Are Reels in 2026?
Instagram Reels help businesses reach new audiences, show products in action, and start conversations. The latest data also shows how short videos are shaping content discovery and advertising.
| 475 likes | 90 shares | 50% | 2× more comments |
| Average likes per Reel in 2025 | Average shares per Reel in 2025 | Share of Instagram time spent watching Reels | Comments on Reels compared with static image posts |
14. Reels can attract 475 likes and 90 shares
As per Statista, the average Instagram Reel in 2025 generated around 475 likes and 90 shares. Generally, Reels received 18 comments and approx under 39 saves. The figure can vary based on your account size, topic, and audience.
If your brand is seeking more reach and viral potential, Reels are the best Instagram way to get you there. Businesses can start by testing out short and useful videos that answer customer questions or show how their products actually work.
15. Reels take up half of the time people spend on Instagram
According to Meta’s internal data, Reels take up roughly 50% of the total time users spend on Instagram. So if your brand is not creating Reels consistently, you are almost not even visible to half of users’ Instagram sessions.
But that doesn’t mean you should post a Reel on every piece of content. It means your content calendar must consider this format if you are using Instagram as your marketing channel.
16. Reels can generate more comments than other formats
Socialinsider’s 2026 Instagram benchmark data report that Reels generate about 45% more comments than carousels and twice as many comments as static image posts. This Instagram feature is worth testing out when you want your customers to start a conversation.
17. More than half of Instagram ads now appear on Reels
Sensor Tower estimates published in August 2026 reveal that more than 50% of Instagram’s ad placements were on Reels in Q2 2026. It means marketers need to get comfortable building creative that feels native to vertical video. Track reach, watch time, shares, comments, and enquiries to find which videos work best for your audience.
Instagram Stories Statistics 2026: How Users Interact with Brands
Instagram Stories now shape the complete Instagram experience. Unlike Reels, Stories are more useful for engaging people who already know your brand.
| 500 million | +88% | 1%–3% | 55% |
| Instagram accounts using Stories daily | Year-over-year growth in Story replies | Typical reported Story link sticker tap-through rate | Poll sticker response rate in a specific research setting |
18. More than 500 million people use Instagram Stories daily
Meta reported that 500 million Instagram accounts used Stories every day. But remember they don’t hype or attention as Reels. Yet they remain one of the best formats for businesses to share timely updates, behind-the-scenes glimpses, polls, reminders, and casual content.
19. Story replies are growing
Metricool’s 2026 Instagram study reported an 88% year-over-year increase in Story replies. These Instagram statistics suggest how useful Stories can be for encouraging direct conversation with followers.
Brands can ask for feedback, ask questions, and respond to product enquiries to create stronger customer relationships.
20. Link stickers help drive website visits
Instagram’s link stickers enable businesses to direct viewers to product pages, booking forms, and other website pages. On average, the tap-through rate for Instagram Story link stickers is 1% to 3% of total Story views, with highly engaged niche audiences occasionally reaching 5% to 10%.
Use clear calls to action such as “Explore products,” “Book now,” or “Read more.” Track link clicks to see whether your Stories bring visitors to your website.
21. Interactive stickers encourage participation
A study published in JMIR Formative Research in 2025 found that poll stickers received responses from around 55% of viewers who saw them in the study setting. Use polls to compare product preferences, question stickers to collect customer queries, and countdown stickers to build interest in a launch or special offer.
Instagram Advertising Statistics 2026: What Marketers Should Know
Instagram advertising statistics show why brands continue to keep investing in this platform. The figures below will help marketers understand how Instagram fits in their marketing plan:
| 1.91 billion | $42.52 billion | $1.83 vs. $3.35 | 48% |
| Potential global audience for Instagram ads | Projected US ad revenue in 2026 | Average CPC for Story ads vs. Feed ads | Marketers who say Instagram delivers the highest ROI among social platforms |
22. Instagram ads can reach 1.91 billion people worldwide
According to DataReportal studies, Instagram’s advertising tools had the potential to reach approximately 1.91 billion users globally.
This gives businesses a huge audience for their campaigns. Use audience targeting, lookalike audiences, and retargeting to connect with people who are more likely to be interested in your products or services.
23. Instagram is expected to earn $42.52 billion in US ad revenue
According to EMARKETER, Instagram is projected to generate approx. $42.52 billion in US ad revenue in 2026, making up an estimated 53.1% of Meta’s US ad revenue.
This shows how important Instagram has become for advertisers. Brands need strong visuals, clear messages, and relevant audiences to make their campaigns stand out.
24. Instagram Story ads can cost less than Feed ads
According to WebFX, the average cost per click is around $1.83 for Instagram Story ads, compared with $3.35 for Feed ads. These are reported averages, and actual costs can vary by audience, industry, and campaign goal.
Businesses can test both placements to see which brings more useful clicks within their budget.
25. Instagram ads may generate fewer clicks than ads on other platforms
WebFX reports that Instagram Feed ads have an average click-through rate (CTR) of 0.22% to 0.88%, while Story ads range from 0.33% to 0.54%.
CTR shows the share of impressions that lead to clicks. Compare results by placement to learn which ads encourage more people to visit your website.
26. Instagram delivers strong returns for many marketers
According to HubSpot’s 2026 State of Marketing report, 48% of marketers said Instagram delivered the highest ROI among social platforms.
Businesses can improve their results by testing different creatives, tracking conversions, and focusing their budget on campaigns that meet their goals.
Instagram Influencer Statistics 2026: Top Accounts, Costs and Trends
Instagram influencer marketing has boomed in the last few years. Brands have shifted more budget toward influencer partnerships, where content creators promote products or services via Reels, Stories, and in-feed posts.
| 68%–80% | 6.23% | 43.6% | 55–300 |
| Brands using Instagram for influencer campaigns | Estimated engagement rate for nano-influencers | Influencer audience aged 25–34 | Estimated cost per Reel for nano- and micro-influencers |
27. Instagram is a leading platform for influencer marketing
Instagram remains the dominant platform for influencer marketing, with roughly 68% to 80% of global brands utilizing it for creator campaigns, as per a ScienceDirect report.
Plus, 57% of brands prefer it as their main influencer platform. Brands can collaborate with creators to promote products, share customer experiences, and reach people who might be interested in their offerings.
28. Nano-influencers can achieve high engagement rates
As per eMarketer reports, Instagram nano-influencers with fewer than 10,000 followers have an estimated 6.23% engagement rate. Bigger reach does not always mean better results. Small creators can be valuable. Brands can compare engagement, audience fit, and content quality instead of just choosing a creator by follower count alone.
29. Most Instagram influencer audiences are aged 25–34
Sprout Social’s 2025 influencer data found that 43.6% of Instagram influencers’ audiences are between the ages of 25 and 34, while 28.92% fall into the age bracket of 18-24.
That makes audience age an important factor when choosing a creator. Always check each influencer’s audience data to see whether it matches your target customers.
30. Nano- and micro-influencers offer affordable ways to reach niche audiences
Influencer collaboration budgets require knowing the cost structures for different influencer tiers. Based on Sprout Social’s influencer marketing platform data, here’s what brands can expect to pay per Reel on average to Instagram influencers:
| Influencer type | Follower count | Estimated cost per Reel |
| Nano | 1K–10K | $55 |
| Micro | 10K–100K | $300 |
| Mid-tier | 100K–500K | $2,750 |
| Macro | 500K–1M | $7,500 |
| Mega | 1M+ | $75,000 |
| Celebrity | Varies | $150,000 |
Nano- and micro-influencers can be useful for brands with smaller budgets. Test a few creators first and track views, engagement, clicks, and sales before expanding your campaign.
31. Most-Followed Instagram Accounts Worldwide
Instagram’s official account has the most followers, and the most-followed individual on the platform is Cristiano Ronaldo.
| Rank | Instagram account | Known for | Followers (approx.) |
| 1 | Official Instagram account | 686.6 million | |
| 2 | @cristiano | Cristiano Ronaldo, footballer | 680.2 million |
| 3 | @leomessi | Lionel Messi, footballer | 517.9 million |
| 4 | @selenagomez | Selena Gomez, singer and actress | 402.8 million |
| 5 | @therock | Dwayne Johnson, actor | 380.7 million |
These accounts are the real example of how much attention Instagram can hold. A large following can improve your reach but not guarantee a campaign’s success. Brands should consider audience relevance and engagement, and how well a creator’s content fits their target customers.
Instagram DM and Automation Statistics 2026
Instagram DMs help businesses answer customer questions, build relationships, and turn interest into sales. With DM automation, brands can respond faster, manage more conversations, and guide potential customers toward the next step.
| 80%–95% | 50%–60% | 7%–20% | $42 billion+ |
| Estimated Instagram DM open rate | Estimated reply rate for conversational DM campaigns | Estimated DM-to-sale conversion rate | Forecast social commerce sales, subject to source and market verification |
32. Instagram DMs can achieve open rates of 80% to 95%
Some industry reports estimate that Instagram DM achieves an open rate between 80% and 95%. The real results will vary by audience, message type, and campaign.
Businesses can use Instagram DM automation to send relevant replies when users comment on posts, respond to Stories, or ask about products. This helps brands continue conversations while users are interested.
33. Conversational campaigns can achieve reply rates of 50% to 60%
Some industry sources report reply rates of 50% to 60% for conversational DM campaigns. Personalised messages and relevant questions can encourage users to respond.
With Getgabs Instagram DM automation, businesses can automate replies to eligible comments and Story interactions, helping them start conversations with interested users.
34. Instagram DM-to-sale conversion rates can reach 7% to 20%
Industry reports estimate that DM-to-sale conversion rates can range from 7% to 20%, depending on the audience, offer, and campaign type. These figures are estimates, not guaranteed results.
Businesses can use DMs to share product details, answer questions, and guide interested customers toward a purchase. Getgabs helps businesses manage these conversations and automate parts of the customer journey.
35. Instagram social commerce creates more opportunities for sales
Instagram helps users discover products through Reels, posts, ads, and business profiles. Industry forecasts put Instagram social commerce sales at more than $42 billion, but the figure should be used only after verifying the source’s market, geography, and forecast year.
Businesses can connect content discovery with customer conversations by answering product questions, sharing relevant details, and guiding shoppers to the next step.
Instagram Business Statistics 2026: How Brands Use Instagram
The Instagram for business statistics will reveal how brands are using this channel to engage with customers and promote products or services. Plus, why Instagram is becoming central to modern marketing, sales, and customer service.
| +19.25% | 78% | 52% | 70% |
| Year-over-year increase in Instagram interactions | Social media marketers using Instagram | Users who prefer short-form videos and Reels | Marketers planning to increase Instagram spending in 2026 |
36. Consumers engage with brands on Instagram regularly
According to Metricool’s 2026 Instagram Study, which analyzed more than 24.3 million posts from 375,000 accounts, Instagram interactions increased by 19.25% year over year. Posts that included a question also received 36.7% more comments.
These findings show that engaging content can help brands start conversations and build stronger connections with their audiences. Share useful tips, ask relevant questions, and respond to comments to encourage more interaction.
37. Around 78% of social media marketers use Instagram
According to Statista, 78% of social media marketers use Instagram. The figure rises to 85% among B2C marketers, while 71% of B2B marketers also use the platform.
This shows that Instagram works for both consumer brands and business-focused companies. Brands can use it to share product updates, build trust, show their expertise, and connect with potential customers.
38. Short-form videos are popular with Instagram audiences
Short videos, especially Reels, give businesses a way to show products, share tips, and reach new audiences. Sprout Social’s 2026 Instagram statistics report that 52% of social media users prefer short-form videos and Reels over other types of brand content on Instagram.
Businesses can test product demos, quick tutorials, customer stories, and behind-the-scenes videos to learn what their audience enjoys.
39. 7 in 10 marketers plan to spend more on Instagram in 2026
Sprout Social’s research shows that around 70% of marketers plan to put more money into Instagram this year. Few brands are stepping back. Most are going all in.
That means more brands will fight for the same attention in the same feeds, so average posts will get lost faster.
Conclusion
Instagram Statistics 2026 mentioned above in this guide that Instagram is more than just a platform for sharing photos or videos. With 3 billion active users globally, it helps businesses reach new audiences, build trust, promote products, and turn customer interest into actual sales.
Be it Reels, Stories, paid ads, or influencer marketing, each feature of this social media platform offers different ways to connect with potential customers. Know your audience by checking the age, gender, and location data. Test Reels for discovery, carousels for teaching, and stories for staying close to followers.
However, getting attention is only the beginning. Businesses should be able to respond to enquiries, answer product questions, and guide interested users towards a purchase. This is where Instagram DM automation brings a huge difference.
With Getgabs Instagram DM automation, brands can automatically send public replies and direct messages in the personal inbox, triggered by specific keywords on reels, posts, or stories. Connect with Getgabs today and turn your Instagram attention into real customers.
Frequently Asked Questions
India has the highest number of Instagram users with approximately 480.55 million users. Followed by the United States in second place with 185.55 million users.